Invitations
Texts each boat the survey details; they accept or register in one tap.
Calibration, survey management, the survey day itself, the editing, the analysis, the map, and the records your association keeps all season. Most associations stitch this together from three or four outfits and chase them all when something doesn't line up. With WaveWise there's one number to call and one place everything lives.
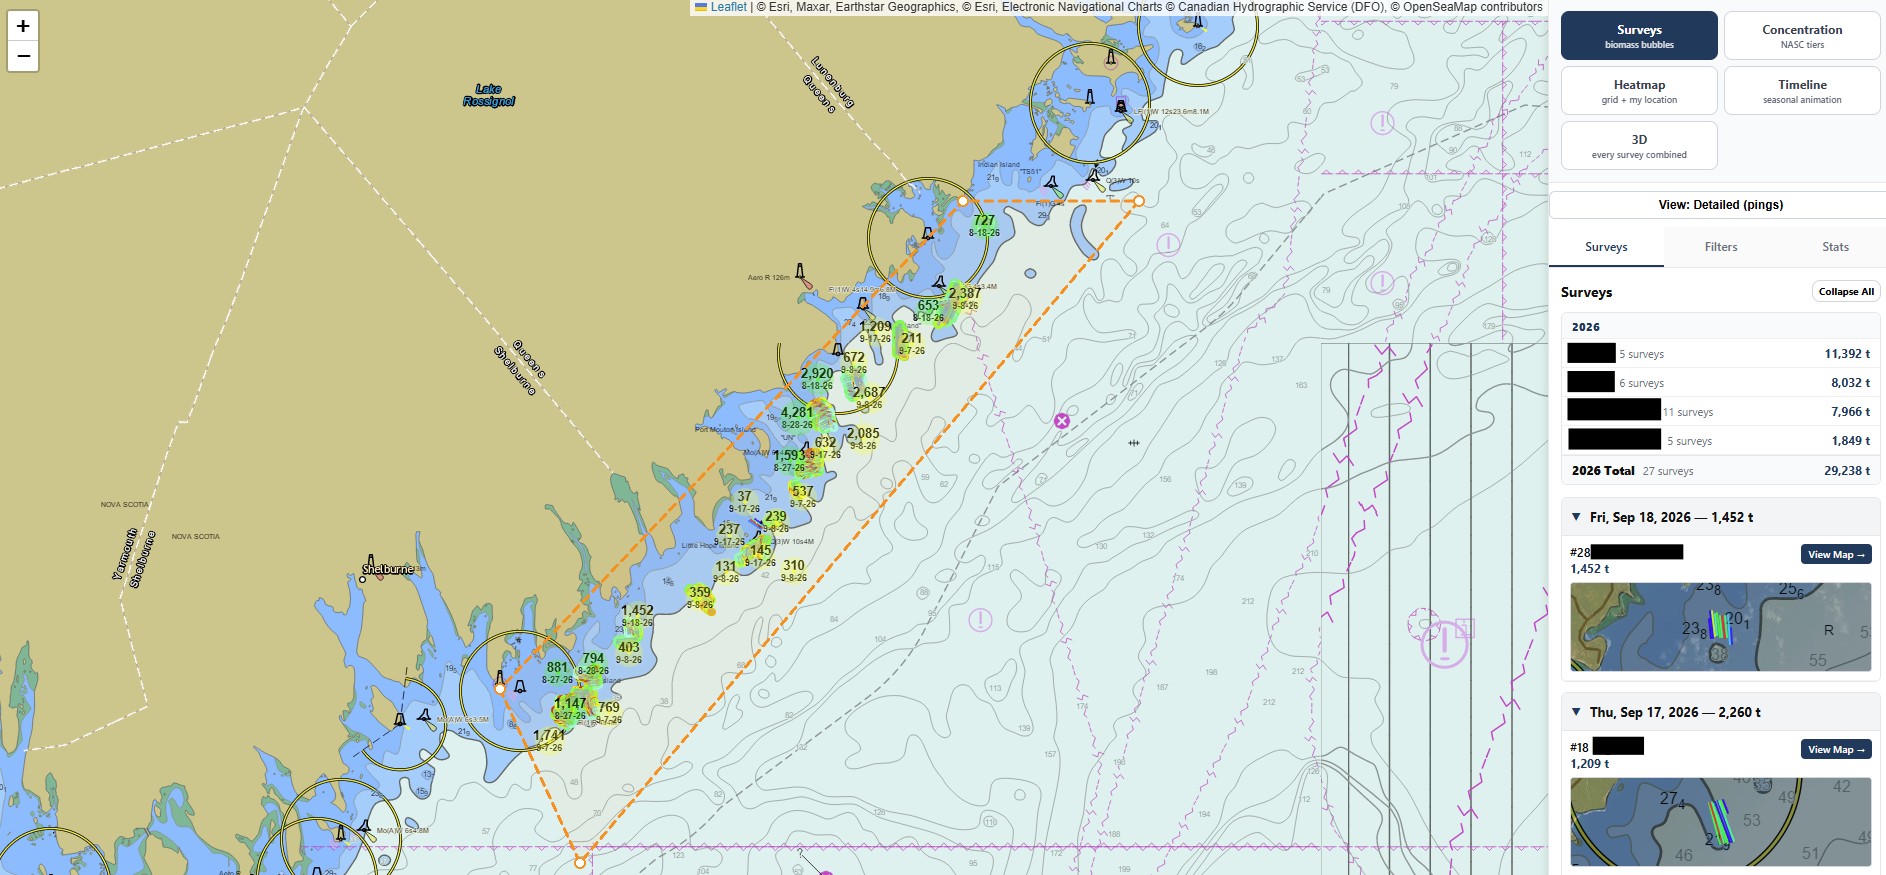
The main map shows every survey your association has run as a bubble on the chart, sized by its biomass, so the season's big results stand out at a glance.
Filter by year, month, dates or survey number and the stats update to match. Switch to concentration, heatmap, timeline, or a 3D view of every survey combined, or open any survey to see every ping.
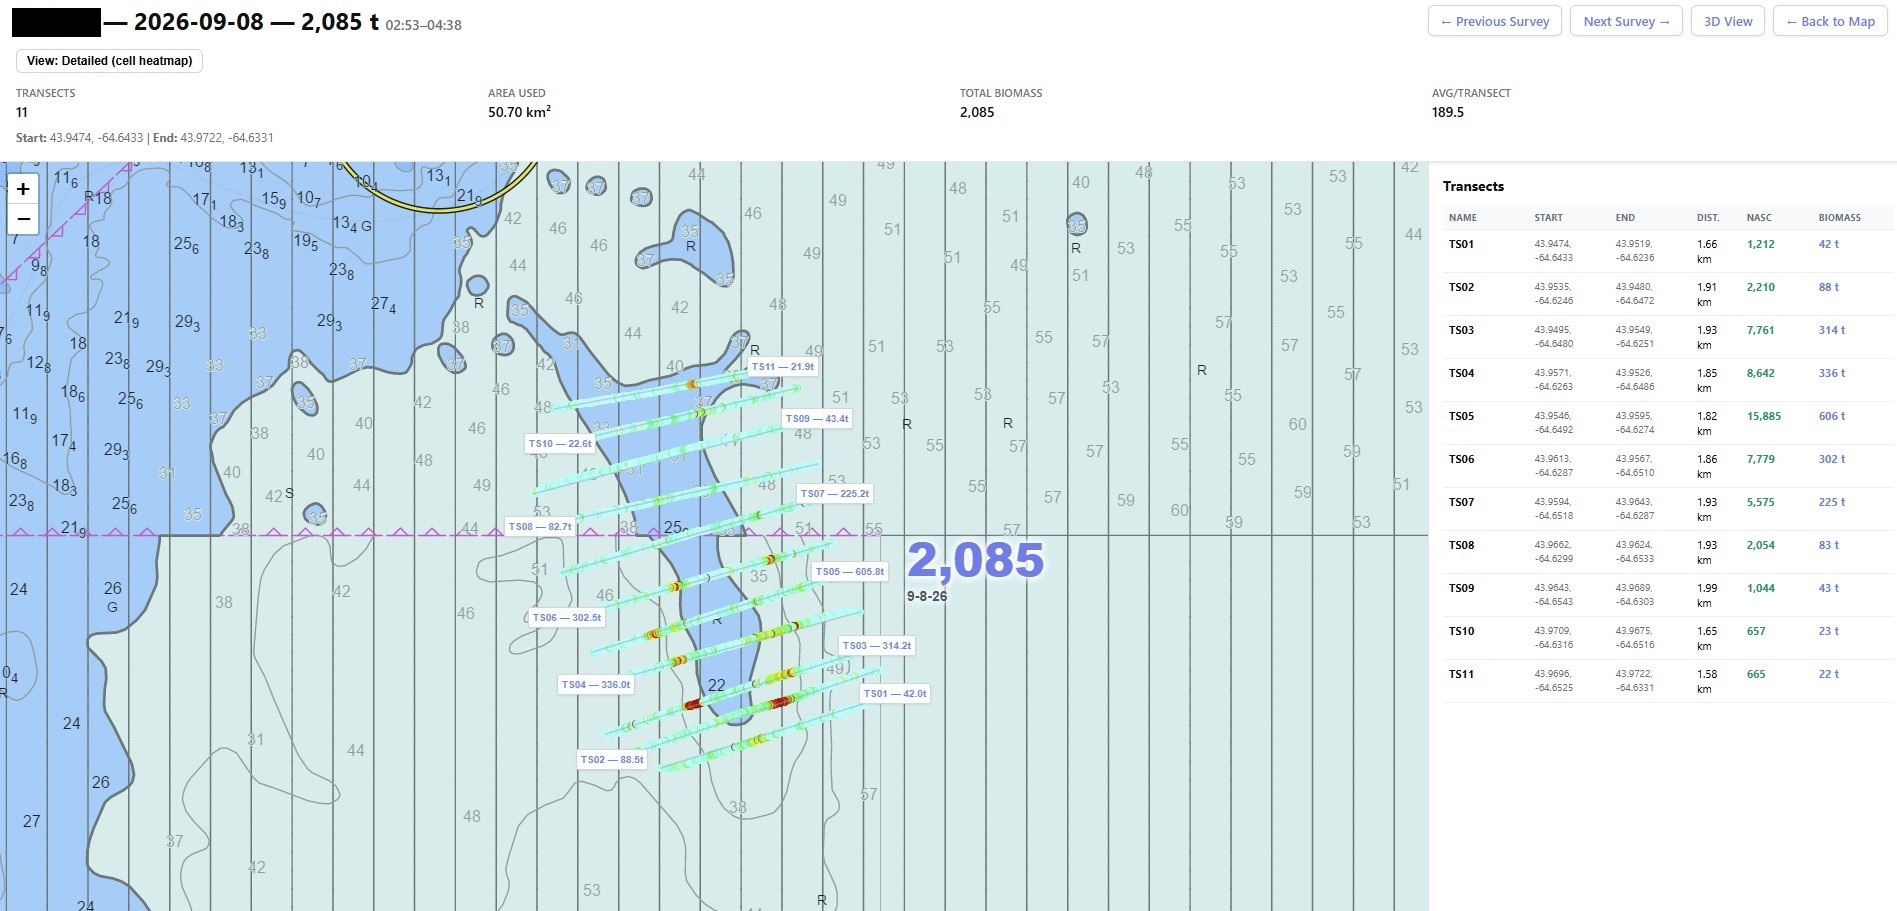
A standard survey report gives you one biomass number per transect. WaveWise keeps every individual ping, so you can see exactly where along the line the fish actually were — not just how many, but where.
Depth, NASC, and biomass are broken out transect by transect, so your association can see which grounds are producing before the fleet goes back out.
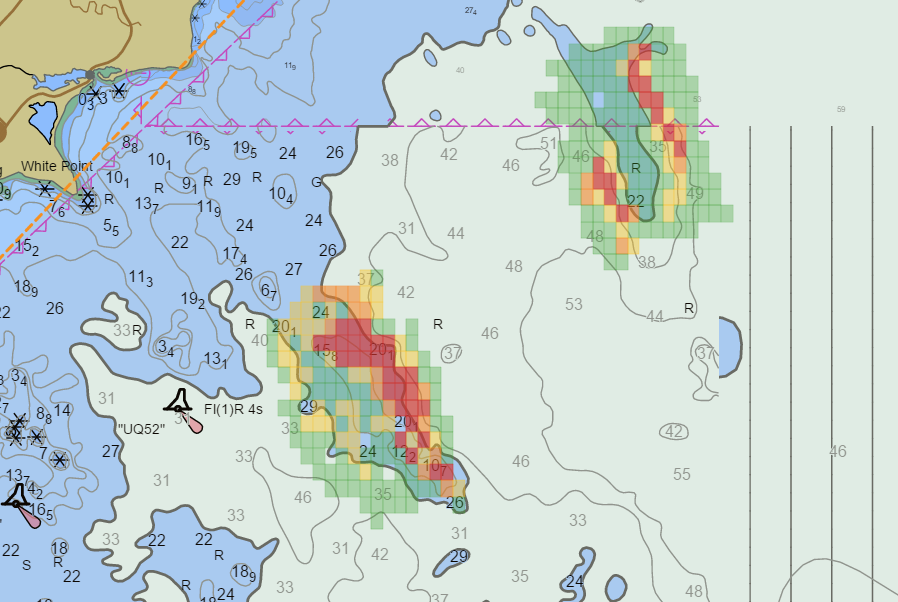
Heatmap view lays your survey results over the real nautical chart as a color-coded grid, from light green where there's little showing to deep red where the fish are packed in tight.
The hot spots jump out at a glance, right on top of the depths and bottom contours your crew already knows, so anyone can see where to set without reading a single number.
Timeline view plays your surveys back in order, so you can watch the fish show up, build, and move across your grounds as the season goes on.
Step through survey by survey or day by day, pause on any point, and see how this year is shaping up before deciding where the fleet heads next.
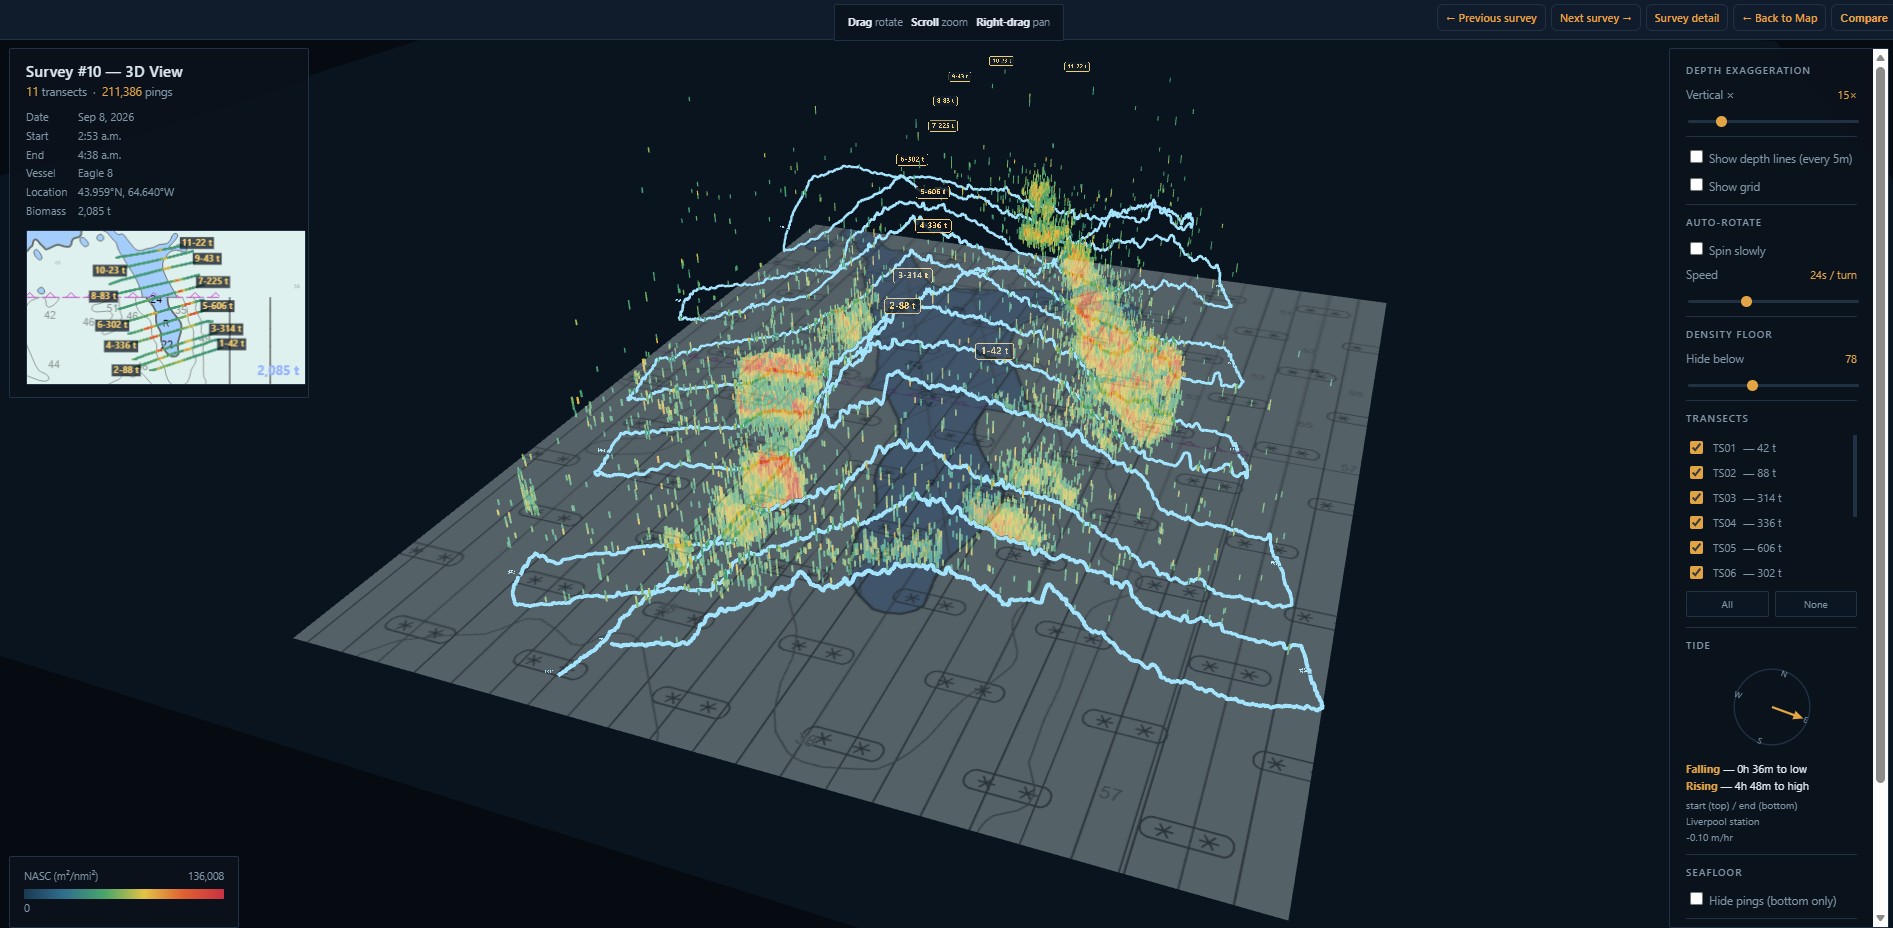
Rotate, zoom, and pan through the true seafloor shape and school density, built directly from your own ping data — with the real nautical chart and tide state laid in underneath.
It's the same survey your association already runs. WaveWise just gives your crew a way to actually see it.
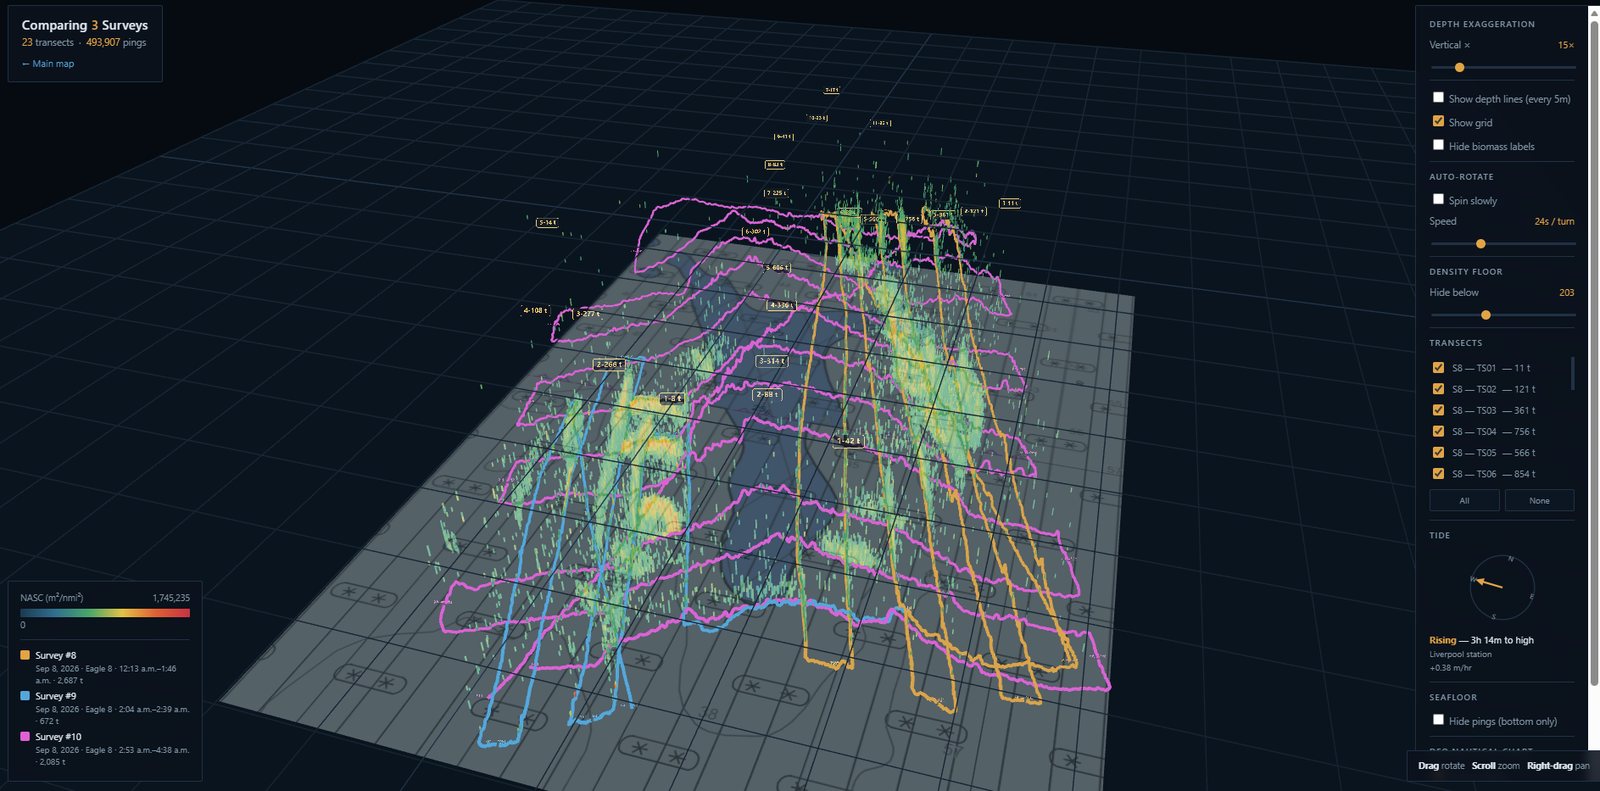
Pick any surveys and view them together on one 3D chart, each one color-coded and correctly oriented in real geography — not just placed side by side.
Watch how a school moves and shifts between visits, so your association can plan the next set with more than a guess to go on.
Survey Coordination puts the whole fleet on the same chart. Each skipper picks a grid line from their phone, and every boat sees every other boat's position and track as the survey runs.
Set the survey area, start time and target speed once. Boats get a countdown and a ready check, and when the survey vessels start, every phone gets the call to go.
Every skipper gets their own guidance on the phone: speed in green, yellow or red against the target, and an arrow that says how many degrees to turn to hold the line.
Mark the shoals and ledges once and they're kept for every survey. Boats are warned before their line crosses one, with where to stop surveying and where to rejoin.
Any boat can mark a school with one tap, rate how good it looks, and add a photo of the sounder. The survey vessels get the alert with distance and bearing, and the first to answer takes it.
Fleet chat keeps everyone talking. When the survey ends, every track, spotting, photo and message is saved to the season record.
Northern Dawn spotted fish at 7:42 AM. Large school, 18 fathoms.
1.4 nm · 128°T / 144°M
Keep the vessel list, licenses and association fees in one place, see quota and catch totals year over year, and add survey dates in a couple of minutes.
| Vessel | License | Fees | Surveys |
|---|---|---|---|
| Sea Hawk | 1042 | Paid | 5 |
| Lady Janet | 1107 | Paid | 4 |
| Allie | 1311 | $250 owing | 2 |
Example data
Each boat gets the survey details by text, with a one-tap link to accept. Support boats register themselves from your association's homepage, and a ready check before the start shows who's set to go.
Boats pick their own grid line, see each other's positions and tracks, and get speed and steering guidance. When fish are spotted, a survey boat takes it.
Every ping, heatmaps over the chart, the season timeline and a full 3D reconstruction, with results in 24–48 hours.
Every survey's tracks, spottings, photos and chat are saved. Catch comes in from skippers' phones, quota remaining updates as it does, and you can see how many surveys each boat has done.
| Vessel | Line | Distance | Avg kn | On speed |
|---|---|---|---|---|
| Sea Hawk | 7 | 18.6 nm | 7.0 | 94% |
| Lady Janet | 9 | 18.2 nm | 6.9 | 91% |
| Allie | 12 | 17.9 nm | 7.1 | 88% |
Example data
Your association's fleet record sits at the centre: vessels, owners, phone numbers and licenses. Invitations, survey lines, catch, quota and the season record all work from the same list, so nothing gets typed twice.
Pick a boat to see what each part of WaveWise knows about it.
Example boats and figures.
Texts each boat the survey details; they accept or register in one tap.
Every boat on its own line, live on one map.
Every ping, heatmaps and 3D, in 24–48 hours.
Skippers report each landing from their phone.
What's left, updated as catch comes in.
License numbers, association fees and who has paid.
Every survey kept: tracks, spottings and who went.
Members see the next survey and register for it.
Add a boat, change a phone number or a license once, and the invitations, the survey map, catch, quota and the season record all have it.
Announcements, an events calendar, a bulletin board and community chat, with the next survey and a one-tap register link up front. Your members see it all in one place, and you run it from a single admin page.
A skipper picks their boat once with a 4-digit PIN, the same one they use for catch reporting, and their phone remembers it. From then on the homepage, the survey map, the register page and the catch app all know which boat they are — and nobody can act as someone else's boat.
The homepage becomes theirs: registered for the next survey, fees owing and when they're due, quota left, the surveys they've run. They can ask to be told when a survey is scheduled, the quota changes, results are posted or fees fall due — by e-mail, text, or both, and only what they ask for.
Fast processing, an easy file handoff, and results anyone on your team can open from a phone or a laptop — the parts that matter, without the parts that don't.
Survey results are processed and analyzed within 24–48 hours — careful manual review, backed by automated analysis for accuracy.
One-click copy of files from the vessel, one-click send to us for processing. Files move in minutes, with nothing complicated for the crew to learn.
Results are shared with your association the moment they're ready — view them on a computer, tablet, or phone, on the dock or on the water.
We look after the sounder end of the survey too — from calibrating the echosounder to the edited files the results come from.
We calibrate your EK80 echosounder and check its settings, so every survey starts from numbers you can trust.
We edit and analyse the survey recordings in Echoview — bottom lines, noise, school marks — and take the exports through to results.
Prefer to edit them yourself, or already have edited files? Send your Echoview output and we'll import it and carry on from there.
Whichever way you work, the survey ends up on the same map and in the same season record.
After manual review, WaveWise runs deeper automated analysis across your survey data — catching patterns and relationships a quick read-through would miss.
Automated analysis surfaces patterns in your survey data for a deeper read on where the fish are.
The same careful analysis applied every time, survey after survey, season after season.
Comprehensive results backed by consistent, repeatable data processing.
More informed input for your association's own management planning.
Every fishing association tracks its grounds a little differently. Whether you're working from survey results, catch data, or something else altogether, we'll shape it into something simple to use and easy to read — built around what you already have, not a template you have to fit into.
Tell us what your association is trying to track, and we'll show you what a solution could look like. Ask for a quote or just start a conversation.
Not a herring association? Tell us what you fish and what you'd like to track — we can customize solutions for any fishery.
Prefer to talk? Call 1 902 319 9693
Join the fishing associations already using WaveWise to plan, run and read their surveys, and keep the whole season in one place.